
Below Average
Why the decline in American education isn’t a uniform slide, but an inequality crisis hiding inside a single average.

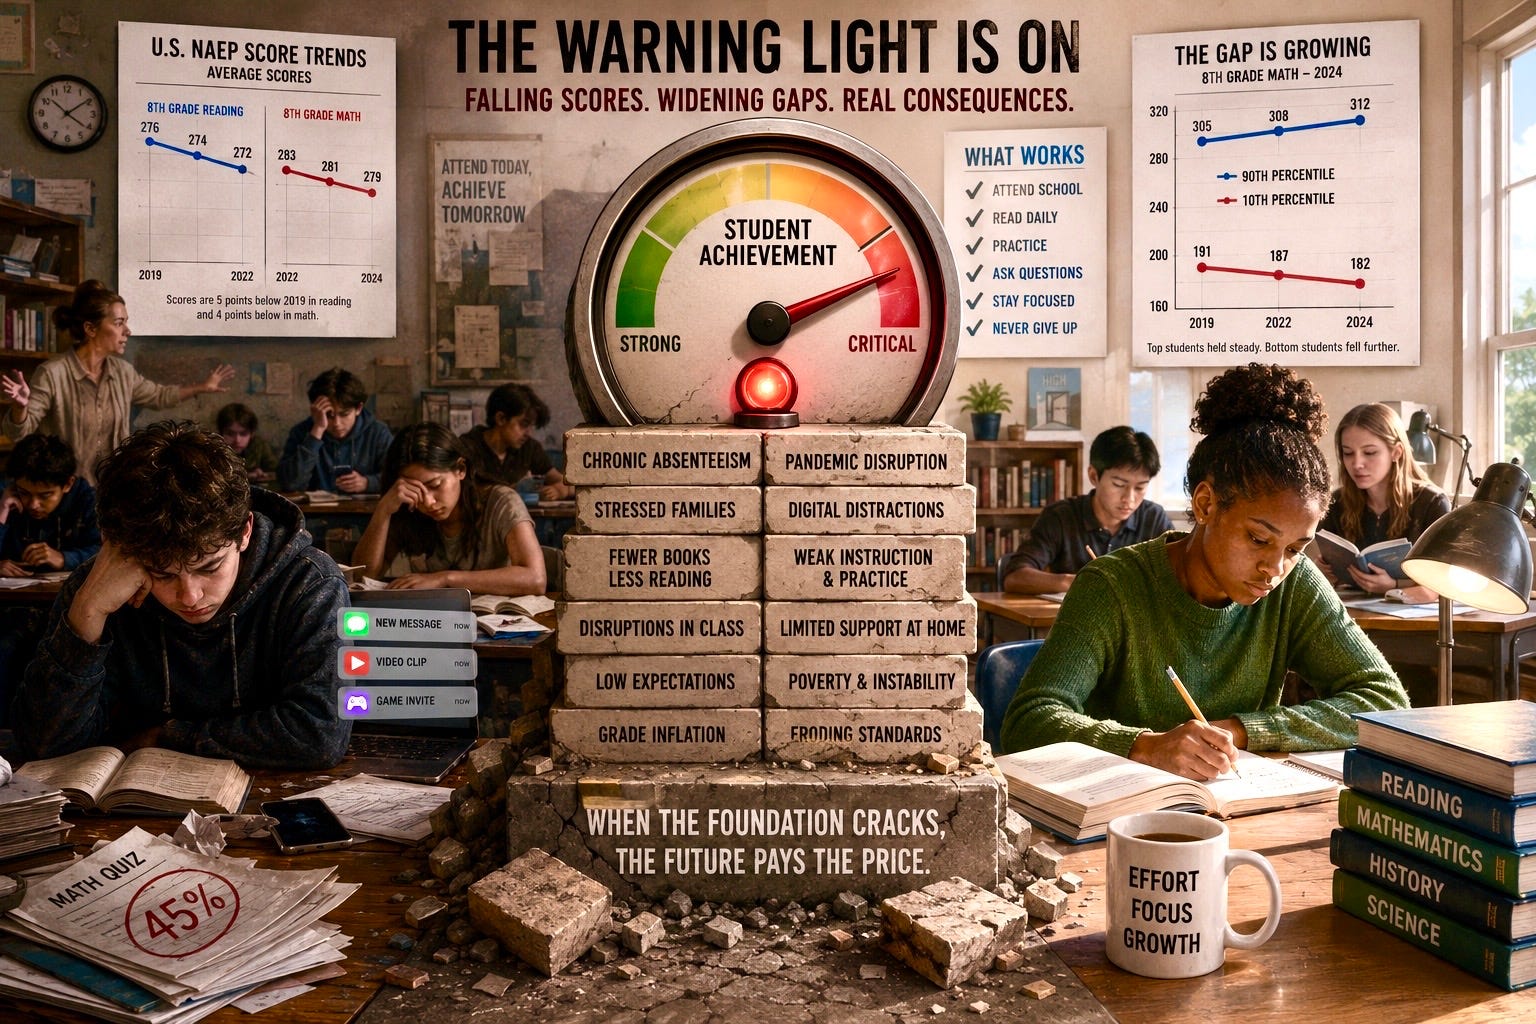
Test scores were slipping before COVID, and the losses are increasingly concentrated among students who started with the least support. The causes are multiple, cumulative, and harder to confront than any single political explanation. For educators, this pattern poses a sharp professional challenge: how to address widening gaps and declining preparedness with the resources and responsibilities already on their shoulders. Nowhere has that problem come into sharper focus than at the University of California, San Diego, where faculty began encountering a problem they could not teach around.
Placement results showed that an increasing number of incoming students lacked the mathematical skills typically expected before college. A January 2026 report from a university Senate–Administration working group found that between 2020 and 2025, the number of entering students testing below high school mathematics standards increased nearly 30-fold. Seventy percent of that group tested below middle-school levels, representing roughly one student in twelve in the entering class.¹ The report identified several developments that coincided with the decline, including pandemic-era educational disruption, the elimination of admissions testing, grade inflation, and increased enrollment from under-resourced high schools. However, coincidence is not causation, and the working group could not tell us precisely how much responsibility belonged to each.
It would be tempting to treat this as a California story, another argument about admissions standards, testing, or university politics. But the problem visible at UC San Diego is part of a much larger national pattern. Across the country’s most reliable assessments, American students are losing ground, and the losses are not evenly distributed. In several of the newest assessments, students near the top have held their ground relatively well, while those near the bottom have continued to fall.
The decline is clear. Its causes are not. COVID did severe damage to American education, but the downturn began before the pandemic, and no single explanation accounts for its timing, breadth, or unequal effects. Instead, what appears is a system of reinforcing weaknesses: poorer attendance, diminished reading habits, fragmented attention, uneven instruction, inadequate practice, disrupted classrooms, weakened expectations, and difficult conditions outside school. Each may explain only part of the decline. Together, they begin to explain why the floor is giving way.
What the Tests Can Tell Us
Discussions of falling test scores often devolve into arguments about testing itself. Standardized tests don’t measure creativity, character, persistence, curiosity, artistic ability, moral judgment, or the many other qualities that make a life go well. Family income, school quality, disability, language, nutrition, stress, health, and home stability all influence performance. All of that is true, and none of it makes the tests useless.
A reading assessment was never designed to measure compassion, and a mathematics assessment was never intended to identify musical talent. Their purpose is narrower: to estimate whether students can read, calculate, reason, and apply knowledge at levels associated with their age or grade, and to show whether those abilities are improving, holding steady, or declining over time. No instrument captures the whole person. A bathroom scale cannot measure cardiovascular or mental health, but it can still tell you whether someone has gained thirty pounds.
The National Assessment of Educational Progress, known as the Nation’s Report Card, provides a similar measure. Its value does not lie in perfection but in continuity. Unlike state proficiency tests, which can be redesigned, rescaled, or politically softened, NAEP provides a common national measure intended to preserve meaningful comparisons across years. it’s not an infallible yardstick, but it’s the closest thing American education has to a stable national one. And lately, it has been pointing in one direction.
The Report Card Keeps Delivering Bad News
The 2024 results were difficult to explain away. The average eighth-grade reading score fell another two points from 2022 and stood five points below its 2019 level, with losses between 2022 and 2024 occurring at the 10th, 25th, and 50th percentiles, the lower and middle portions of the performance distribution.²
Twelfth-grade reading showed an even longer deterioration. The 2024 average was three points below 2019 and ten points below 1992, when the comparable trend line began. Compared with 2019, scores were lower across all reported performance percentiles except the 90th.³
Mathematics tells a similar story. Fourth-grade mathematics improved by two points between 2022 and 2024 but remained three points below 2019, and even that partial recovery was uneven: students at the 50th, 75th, and 90th percentiles improved, while those at the 10th and 25th percentiles showed no statistically significant progress.⁴
Among eighth graders, the 2024 national mathematics average was not significantly different from 2022 and remained well below its pre-pandemic level. Beneath the average, however, the divide widened, with scores rising at the 75th and 90th percentiles while falling at the 10th and 25th.⁵
Twelfth-grade mathematics was three points below both 2019 and 2005, the beginning of the current trend line, and once again scores fell throughout nearly the entire distribution, with the 90th percentile the sole exception.⁶
That pattern matters more than the national average alone suggests. This is not a uniform slide in which every student loses the same amount. There is an increasing divergence between students who can obtain educational support privately and those who depend almost entirely on schools to provide it. Students with stable homes, demanding schools, educated parents, tutors, quiet places to work, ample books, and adults who enforce academic expectations are more likely to remain on track. Students without those advantages depend more heavily on schools to supply structure, continuity, instruction, and practice.
Schools can respond to this widening gap by strengthening support systems for students who lack these private resources. Possible interventions include targeted small-group tutoring, after-school academic programs, access to quiet study spaces, and expanded partnerships with community organizations to provide mentoring or enrichment. Providing additional reading materials, technology, and regular communication with families can also help close learning gaps. Professional development for teachers focused on differentiating instruction and cultivating strong relationships may further support students most in need.
When schools weaken at those functions, inequality widens even if no policy formally intends it.
The average compresses that divergence into a single number. Underneath it, the floor is falling faster than the ceiling.
COVID Accelerated the Decline - It Did Not Cause It
The pandemic inflicted real and lasting harm. Classrooms closed. Remote instruction ranged from competent to nearly nonexistent. Students disappeared from rosters, attendance declined, and teachers tried, often unsuccessfully, to replicate in a virtual setting what had previously relied on presence, routine, conversation, and human attention.
Mathematics absorbed an especially large share of the damage because it’s unusually cumulative. A student who misses a unit on the Civil War can still follow a later unit on the Progressive Era, but a student who never masters fractions carries that gap into ratios, algebra, geometry, chemistry, finance, and almost every quantitative course that follows.
COVID, therefore, belongs near the center of any account of recent learning loss. It does not, however, deserve to be treated as the sole cause. American academic performance had already softened before 2020, following years of gains and then stagnation, and international results show a similar, though not identical, pattern.
Across OECD countries, average PISA mathematics scores fell by a record 15 points between 2018 and 2022, while reading fell by 10 points. The OECD concluded that the pandemic accounted for only part of the deterioration, as reading and science had already been trending downward for roughly a decade, while mathematics had been broadly stable across the OECD before its unprecedented 2022 collapse.⁷
In the United States, 2022 math performance was among the weakest the country had recorded in PISA. Reading and science were closer to their longer-term levels, indicating that the picture is not uniform across all tests, subjects, or age groups.⁸ That distinction matters, but so does the larger pattern: progress had slowed or reversed before COVID, deteriorated sharply during it, and has recovered unevenly since, with the weakest students generally losing the most.
The pandemic was the accelerant. It wasn’t the match.
A System of Causes
The evidence is stronger for some explanations than for others. Attendance, instructional quality, practice, classroom climate, reading habits, attention, family circumstances, and academic expectations all affect learning, but researchers cannot yet precisely calculate how much each contributed to the national decline or explain why their combined effects became so visible when they did. No honest account should pretend otherwise. Still, several developments fit the pattern.
Attendance and Continuity
A child cannot learn material they are not present to be taught. That sounds too obvious to require emphasis, yet attendance has long been in the background of an education debate dominated by curriculum, funding, testing, and accountability.
Chronic absenteeism is generally defined as missing at least 10 percent of the school year, approximately eighteen days in a typical 180-day calendar, which is nearly a month of instruction.⁹ Absenteeism rose dramatically during the pandemic and remained elevated afterward. The national increase does not, by itself, prove how much absenteeism caused the fall in test scores, and the relationship runs in both directions: students who are struggling may become more reluctant to attend, while missing school causes them to struggle further.
But the educational mechanism is not difficult to understand. A student who misses the introduction to fractions may return for the lesson on multiplying them. A child absent when phonics patterns are introduced may encounter later texts without the decoding tools other students possess, and a teacher must then choose among slowing the class, reteaching earlier material, giving the returning student separate help, or allowing the gap to widen. Multiply that problem across a classroom with several frequently absent students, and the pace of instruction changes for everyone.
Learning depends on sequence, and missed lessons don’t disappear. They return as future confusion.
The pandemic may also have weakened the social expectation that attendance is nonnegotiable. Mandatory quarantines, intermittent closures, remote assignments, and mixed schedules blurred the line between attending school and merely keeping up with schoolwork. That does not prove a permanent cultural shift, but it does suggest a plausible reason attendance did not immediately return to its former pattern when buildings reopened. School stopped feeling like something with a firm floor beneath it.
Reading and Attention
Reading is not simply one subject among others. it’s part of the machinery that makes nearly every other subject possible. A student with weak comprehension does not struggle only in English; that student also struggles with history, biology, written instructions, and math problems whose difficulty lies as much in language as in calculation.
Sustained reading develops vocabulary and background knowledge. It requires readers to retain earlier information, follow an argument across an extended text, tolerate ambiguity, and postpone the gratification of reaching an immediate conclusion. American children appear to be doing less of it. In 2023, only 14 percent of thirteen-year-olds reported reading for fun almost every day, compared with 27 percent in 2012, the lowest rate recorded in that NAEP series. Students who reported reading more frequently also tended to earn higher reading scores, although that association alone cannot prove that recreational reading caused the difference.¹⁰
At the same time, students are spending more of their lives with electronic content organized around novelty, speed, reaction, and interruption. The problem is not that screens are inherently corrosive: a tablet can hold a library, and a computer can provide access to lectures, archives, simulations, and the accumulated knowledge of civilization. The question is what the screen usually delivers.
Books ask readers to stay with one subject, recall earlier information, follow a line of reasoning, and resist the impulse to move on. Short-form digital services generally reward something different: reacting quickly, seeking novelty, scrolling onward, and staying available for the next interruption. Those habits are not morally opposed, but neither are they cognitively interchangeable.
it’s easy to overstate the argument by claiming that smartphones are “rewiring the brain” or destroying an entire generation. Every new medium has inspired predictions of intellectual ruin, and many proved absurd. But rejecting the exaggerated claim does not require denying the more modest one. Repeated task-switching divides attention and can reduce the effectiveness of encoding and retaining information. A student may complete an assignment while moving among messages, videos, music, games, and notifications; the work gets submitted, but submission is not mastery, and looking at an explanation is not the same as absorbing it.
PISA results present a reason for concern without settling the causal question. Across OECD countries, roughly 30 percent of students reported being distracted by their own use of digital devices during most or every mathematics lesson, while approximately one quarter reported distraction from other students’ devices. Students reporting such distraction also scored lower on average, even after accounting for socioeconomic differences.¹¹ Those results don’t prove that phones caused the national decline. Lower-performing students may use devices differently, and struggling classrooms may permit more distraction, but these don’t establish that digital distraction is common or associated with weaker performance.
No teacher with a whiteboard is competing on equal footing with an industry built to hold attention, reward repeated engagement, and make disengagement feel like deprivation.
Instruction and Practice
Method matters. In reading, influential instructional approaches sometimes encouraged children to identify unfamiliar words using pictures, context, and sentence patterns rather than relying first on systematic decoding. The renewed emphasis on explicit phonics reflects extensive evidence that beginning readers generally benefit from direct instruction in the relationship between letters and sounds. Phonics is not the whole of reading; children also need vocabulary, fluency, background knowledge, comprehension, and exposure to worthwhile texts. But children cannot comprehend words they cannot consistently identify.
Mathematics experienced its own reform cycles, many of which were valuable efforts to help students understand why procedures work rather than merely imitate a sequence of steps. That was a legitimate correction to mindless instruction, but it was never a reason to abandon practice.
Understanding and fluency are not rivals. A child should understand what multiplication means and also know the multiplication tables well enough that elementary arithmetic does not consume the working memory needed for more difficult reasoning. A reader should understand a passage and also recognize common words rapidly enough that decoding does not exhaust attention before meaning can emerge.
The same principle applies to factual knowledge. “Critical thinking” does not operate in a vacuum. People evaluate claims by comparing them with what they already know: they recognize an implausible date because they know the sequence of events; they identify a misleading statistic because they understand percentages and probability; and they detect a false historical analogy because the relevant history is already in memory. Knowledge was never the enemy of thinking; it’s the material on which thinking runs.
Practice fell under suspicion in some educational circles because too much of it had become dull, mechanical, or poorly designed, and the criticism was not baseless. Busywork deserves to be criticized. But the alternative cannot be a system in which students encounter a skill briefly, perform it with assistance, and move on before they can reproduce it independently.
Musicians drill scales. Athletes repeat movements. Pilots rehearse procedures. Surgeons build routines they can execute reliably under pressure. No serious discipline assumes that understanding something once eliminates the need to practice it. Automaticity is what practice buys. Without it, students may appear to understand during a guided lesson yet be unable to perform the same operation later without prompts, examples, or assistance; recognition is mistaken for knowledge until an independent assessment exposes the difference.
Order and Expectations
Learning requires an environment where teachers can teach and students can focus on what is in front of them. Many disciplinary reforms responded to genuine injustice: suspensions were sometimes overused, applied unevenly, or imposed in ways that worsened academic failure without addressing its causes. But reducing consequences without creating an effective alternative produces a different kind of injustice. A small number of persistently disruptive students can consume the learning time of everyone else in the room.
National data don’t establish that any particular discipline reform caused worsening academic performance, but they do show that disruption is a meaningful obstacle to instruction. In the 2020–21 school year, 32 percent of public-school teachers agreed that student misbehavior interfered with their teaching, while 37 percent said tardiness and class cutting did so.¹² PISA offers a corresponding student perspective: more than one fifth of students across OECD countries reported that they could not work well during most or all mathematics lessons, and substantial numbers said students did not listen, teachers waited for classes to quiet down, or work did not begin promptly.¹³
A classroom repeatedly interrupted by conflict, defiance, noise, phone use, or disorder cannot move at the pace of an orderly one. Lessons fragment. Teachers spend attention negotiating behavior rather than explaining material, and students who arrive ready to learn receive less instruction because other needs dominate the room. None of that appears neatly in a test score until, eventually, it does. Lost minutes become lost hours, lost hours become unlearned material, and the deficit follows the student into the next grade.
Compassion for a struggling child should not require indifference to the other children trying to learn.
Expectations matter for similar reasons. They shape behavior not through inspirational slogans but through the work adults actually require. In some schools and classrooms, grading has become more forgiving through minimum-grade policies, adjustable deadlines, repeated revisions, reduced penalties for incomplete work, or efforts to separate academic mastery from behavior. Some of those reforms have legitimate purposes: a zero can distort an average, a missed deadline may reflect a family crisis rather than a lack of understanding, and allowing revision can encourage a student to keep working rather than accept failure.
But such policies can also weaken the link between the grade awarded and the knowledge independently demonstrated. The UC San Diego working group explicitly identified grade inflation as one possible contributor to the widening mismatch between students’ transcripts and their placement performance. That does not prove grade inflation caused the national decline, but it does illustrate the problem: a credential can remain impressive even as the competence it supposedly represents weakens.
Students with disabilities, illnesses, language barriers, or family crises may need different routes to the same academic objective, and proper accommodations offer equitable access to instruction and assessment without necessarily eliminating the underlying expectation. The concern arises when what must ultimately be demonstrated quietly diminishes. Lower expectations can improve grades, promotion rates, and graduation statistics while leaving actual competence unchanged. Eventually, an assessment conducted outside the local grading system exposes the difference.
Holding a line on expectations is not cruelty. it’s one way adults communicate that students are capable of serious work and that adults are willing to help them do it.
Conditions Beyond School
Not every explanation belongs in the classroom. Children carry the rest of their lives with them: housing instability, food insecurity, family stress, community violence, untreated health problems, interrupted schooling, and parental exhaustion. Some are learning English and academic content at the same time. Others move frequently between schools or arrive after long gaps in formal education. Some live in homes where no adult has the time, education, or emotional reserves to supervise homework and reading.
These conditions make teaching more difficult and learning less consistent. They also make simple explanations dangerous. it’s easy to blame schools for problems rooted in housing, health, employment, family breakdown, or neighborhood safety, and it’s equally easy to invoke poverty as though it relieved schools of responsibility for teaching children who need them most. Neither position is adequate.
Social conditions influence how difficult the work of schooling will be. They don’t determine whether schools must do it.
Nor can demographic change by itself explain the international pattern. PISA declines occurred across countries with very different immigration levels, household structures, poverty rates, educational systems, and cultures. In the United States, immigrant students did not perform significantly worse than non-immigrant students in 2022 PISA mathematics before socioeconomic adjustment; after adjustment, they performed better.¹⁴
The more unstable a child’s life outside school becomes, the more important it’s for school to provide order, continuity, knowledge, and high expectations. When those functions weaken as outside pressures intensify, students with the least private support suffer the most.
AI Is Not the Cause - It May Become the Complication
Artificial intelligence is too new to explain a decline that began years before ChatGPT. It may, however, make recovery more difficult.
Used well, AI can serve as a remarkably patient tutor. It can explain a concept repeatedly, generate practice problems, adjust difficulty, translate material, and provide immediate feedback. However, realizing these benefits requires deliberate use. Effective integration of AI in learning depends on several best practices: educators should emphasize using AI for guided practice rather than for completed answers, encourage students to show their reasoning and learning process, and design assignments that require original thought, reflection, or in-person demonstration of skills. AI tools can be most valuable when paired with clear instructional goals, periodic supervised assessment, and honest conversations with students about appropriate use and moral boundaries. Used badly, AI allows students to bypass the mental work that produces learning. A machine can summarize the chapter, solve the equation, draft the essay, and write the code, and a student can submit a polished result while understanding very little of the underlying content.
That creates a measurement problem. Take-home work increasingly shows what a student can produce with assistance, not necessarily what the student can do independently. In the AI era, supervised assessment may become more important rather than less, because it’s one of the few remaining settings in which the work must meaningfully originate with the person being evaluated.
There is not yet sufficient longitudinal evidence to determine AI’s net effect on student learning at the national scale. AI itself is not the enemy, and students will use it in their future workplaces and should learn to use it intelligently. But a calculator helps only when the user understands enough mathematics to recognize an absurd answer, and an AI-generated argument is useful only to someone capable of detecting faulty reasoning, fabricated evidence, and confident nonsense.
Tools amplify competence. They don’t create it.
The Same Weaknesses Appear Beyond School
The OECD’s Survey of Adult Skills suggests that the problem extends beyond K–12 assessments. American adults between sixteen and sixty-five scored near the OECD average in literacy, yet below it in numeracy and adaptive problem-solving. More troublingly, Americans between sixteen and twenty-four scored below the OECD average in all three categories.¹⁵
These assessments don’t measure obscure academic knowledge. They examine whether people can understand written information, reason with numbers, interpret practical material, and solve problems whose solutions are not immediately obvious. The consequences extend beyond individual earnings. Citizens must evaluate political claims, understand probability, interpret risk, and distinguish a meaningful statistic from a misleading graph. Employees must learn new systems, identify errors, and exercise judgment when an automated answer sounds plausible but is wrong.
A society can compensate for declining general competence by relying more heavily on a limited pool of highly capable people. That works until the pool becomes too small, the institutions surrounding it become too weak, or the experts themselves are mistaken.
What We Know and What We Don’t
We know that American reading and math scores have fallen. We know that several measures had stagnated or declined before the pandemic. We know that the pandemic made matters worse. We know that the losses have often been greatest among lower-performing students, while many of the highest-performing students have remained comparatively stable. We know that absenteeism rose, recreational reading declined, digital distractions became widespread, and substantial numbers of teachers and students report that classroom conditions interfere with learning.
Educators now face decisions about where to focus limited time and resources. Strengthening core supports—such as improving attendance, increasing opportunities for sustained reading, fostering orderly learning environments, and ensuring that expectations and grading practices reflect genuine mastery—are promising areas for action within schools. Beyond the classroom, educators can champion stronger partnerships with families, expanded access to tutoring or enrichment, and policies that sustain consistency and engagement. By concentrating efforts where needs are greatest and collaborating to rebuild the foundations of learning, educators can help reverse these troubling trends.
Research gives strong reason to believe that attendance, instructional quality, practice, classroom climate, family circumstances, technology, and expectations all affect achievement. What we cannot honestly do is identify one villain. No single policy, party, union, curriculum, technology company, demographic change, or educational philosophy accounts for the whole pattern.
Education is cumulative. So is educational failure. A child who receives weak reading instruction, misses 20 days of school, spends much of the day distracted by a phone, rarely reads at home, sits in a disorderly classroom, gets little independent practice, and advances without fully understanding the material is not suffering from a single cause. That child is living within a system of causes, each making the others more damaging.
The most important division in American education may no longer be between students who attend “good schools” and “bad schools” in any simple sense. It may be between students whose families can privately replace what schools fail to provide and those whose families cannot. A child with tutoring, books, academic supervision, stable routines, and enforced limits on technology may survive a weak curriculum, inconsistent classroom order, or relaxed grading. A child without those supports has nowhere else to obtain what school withholds.
That is how a general decline becomes an inequality crisis.
The Warning Light
American students have not lost their native intelligence. They remain as capable of curiosity, discipline, invention, and achievement as any generation before them, and students still performing at exceptional levels prove that human capacity has not changed. The environment in which that capacity must develop has.
Children are reading less for pleasure, attending less consistently, and trying to learn amid distractions no previous generation faced to the same degree. Teachers are being asked to compensate for social problems they did not create, often without the authority, time, or support needed to maintain order and uphold academic expectations.
The pandemic hurt. The decline began before it. Technology may help repair the damage, or it may replace the effort that repair requires. Poverty and instability make teaching harder, but they don’t make failure acceptable or improvement impossible.
The tests did not cause the decline. They are the instrument reporting it, the warning light that has been flashing for years.
The tempting response is to cover the light. The only response worth anything is to find out why it’s on.
Sources and Further Reading
UC San Diego Senate–Administration Working Group on Admissions, Final Report on Admissions Review, January 8, 2026. The report found a nearly thirtyfold increase from 2020 to 2025 in entering students testing below high-school mathematics levels; 70 percent of that group tested below middle-school levels, amounting to roughly one in twelve students in the entering cohort. (Senate)
National Center for Education Statistics, The Nation’s Report Card: 2024 Reading Assessment, Grade 8. The average fell two points from 2022 and five points from 2019; scores declined at the 10th, 25th, and 50th percentiles between 2022 and 2024. (Nations Report Card)
National Center for Education Statistics, The Nation’s Report Card: 2024 Reading Assessment, Grade 12. The average was three points below 2019 and ten points below 1992; all selected percentiles except the 90th declined from 2019. (Nations Report Card)
National Center for Education Statistics, The Nation’s Report Card: 2024 Mathematics Assessment, Grade 4. The average rose two points from 2022 but remained three points below 2019; gains were recorded at the 50th, 75th, and 90th percentiles, but not at the 10th or 25th. (Nations Report Card)
National Center for Education Statistics, The Nation’s Report Card: 2024 Mathematics Assessment, Grade 8. The national average was statistically unchanged from 2022, while scores rose at the 75th and 90th percentiles and fell at the 10th and 25th. (Nations Report Card)
National Center for Education Statistics, The Nation’s Report Card: 2024 Mathematics Assessment, Grade 12. The average was three points below both 2019 and 2005; all selected percentiles except the 90th declined from 2019. (Nations Report Card)
OECD, PISA 2022 Results, Volume I: The State of Learning and Equity in Education. Across OECD countries, average mathematics performance fell by 15 points, and reading performance fell by 10 points between 2018 and 2022. The OECD reported that reading and science had already been declining over the preceding decade, while mathematics had been broadly stable before 2022. (OECD)
OECD, PISA 2022 Results: United States Country Note. The United States recorded one of its weakest mathematics performances in the PISA series, while reading and science were comparatively more stable.
U.S. Department of Education, “Chronic Absenteeism.” The department defines chronic absenteeism as missing at least 10 percent of school days, or approximately eighteen days in a typical year. (U.S. Department of Education)
National Center for Education Statistics, NAEP Long-Term Trend Assessment Results: Reading and Mathematics at Age 13, 2023, together with NCES data on recreational reading. (Nations Report Card)
OECD, PISA 2022 Results, Volume II: Learning During—and From—Disruption. Approximately 30 percent of students across OECD countries reported being distracted by their own devices in most or all mathematics lessons, and approximately 25 percent reported being distracted by classmates’ devices. (OECD)
National Center for Education Statistics, “Teachers’ Reports of Disruptive Student Behaviors and Staff Rule Enforcement.” In 2020–21, 32 percent of public-school teachers said misbehavior interfered with their teaching, and 37 percent said tardiness and class cutting did so. (National Center for Education Statistics)
OECD, PISA 2022 Results, Volume II, chapter on life at school and support from home. More than 20 percent of students across OECD systems reported being unable to work well during most or all mathematics lessons. (OECD)
OECD, PISA 2022 Results: United States Country Note, analysis of immigrant and non-immigrant performance.
OECD, Survey of Adult Skills 2023: United States, published 2024. US adults scored close to the OECD average in literacy and below it in numeracy and adaptive problem-solving; Americans aged sixteen to twenty-four scored below the OECD averages in all three domains. (OECD)
Author’s Note
The decline in American student performance is firmly documented. The relative contribution of the possible causes discussed here is not. Attendance, reading habits, digital distraction, instructional practices, classroom climate, grading, family circumstances, and academic expectations are supported by varying degrees of evidence, but no existing research permits us to assign each a definitive share of the national decline. Where this essay moves from established findings to interpretation, it does so deliberately and with that limitation in mind.
There are several promising areas for further research. Future studies could examine the relative weight and interactions among variables contributing to learning loss, such as separating the impact of absenteeism from that of digital distraction across demographic groups. Longitudinal research could track the long-term effects of pandemic-era disruptions on student outcomes. Other important questions include how grading reforms and classroom management practices affect learning over time, how best to integrate technology and AI for meaningful improvement, and which supports most effectively close gaps for students with limited resources outside school. Deeper investigation into these areas would help teachers and decision-makers design more effective interventions.
I read the piece offline, hence I'm a bit late with my comments. I am not going to quibble with anything you wrote, I am just going to notice something you didn't write - you didn't write about food.
How can someone learn if they haven't had a nutritious breakfast? How can someone learn if their belly is rumbling? How can someone concentrate on Athens and Sparta if they're counting down the time until lunch?
There have been a number of pieces over the last couple of days about the effects of that truly big ugly bill, how it has affected SNAP and Medicaid and earlier today I read a piece about the cuts at WIC, which is cutting access to fruit and vegetables. It would not surprise me if I found that they were monkeying with (free) school meals as well.
Yes, proper schooling is important for children to learn, but so are the basics like food and shelter!
Excellent article!